Science Relationship between airspeed and lift produced, and AoA and lift produced

Dambuster

Member
Joined
Sep 13, 2008
Messages
790
Reaction score
1
Points
18
Location
UK
I've got a physics coursework assignment where I gathered data on the following things:
Airspeed vs lift produced
Angle of attack vs lift produced

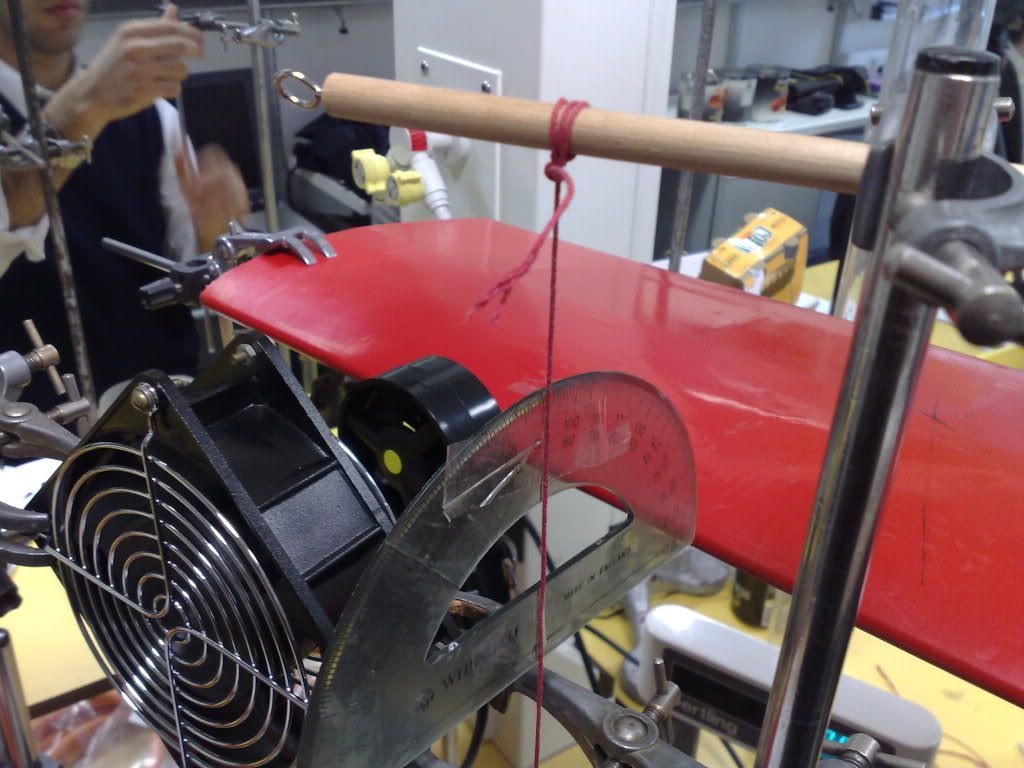
My experiments were done in very basic high school physics lab conditions, using a fan, a wing, an anemometer, a variable transformer, and various stands and clamps that I used to support the above. I've moved into the stage of analysing my data (both sets of which have a correlation coefficient of about 0.98:huh:), and am wondering what sort of relationship I should be expecting between each set of data. I know that the correlation coefficient strongly implies that it's linear, however I (and my teacher) both expected it to be an x^2 relationship...

Also, in my second experiment (the angle of attack vs lift produced one), I was trying to find out at which point the wing would stall. I varied the AoA between +40 and -40 (which I thought would be a more than sufficient margin of error for the stall angle), however the only point where it doesn't appear to be linear is a single data point for -40, which is probably erroneous. I'm at a complete loss as to why it didn't stall - could it be that since I was using such a low airspeed (2.3 - 3 m/s), the boundary layer just stuck to the shape of the wing anyway?

I just looked at this NASA website: http://www.grc.nasa.gov/WWW/K-12/airplane/lifteq.html which contains a formula for calculating lift - it seems to say that the graph should be vaguely like an x^2, so now I'm thoroughly confused.

Any advice/help is much appreciated!
 
E

ex-orbinaut

Guest
Dambuster,

How are you visualizing the airflow over the aerodynamic profile to know when it has stalled (as in laminar flow separation)? Smoke? Lengths of yarn taped to the wing?

Also, before adding anymore to this, how are you ensuring that you are not getting a swirling (vortex) airflow over the airfoil? Using a fan produces this. If you don't use some contraption to "straighten" the airflow after it is produced by the fan, you are starting on a confusing note, as it will give you misleading figures.
 

n72.75

Move slow and try not to break too much.
Orbiter Contributor
Addon Developer
Tutorial Publisher
Donator
Joined
Mar 21, 2008
Messages
2,699
Reaction score
1,361
Points
128
Location
Saco, ME
Website
mwhume.space
Preferred Pronouns
he/him
Find the differential area of a specific part of the wing, and the differential pressure at that part of the wing. Then integrate across the top and bottom of the wing.
 

Dambuster

Member
Joined
Sep 13, 2008
Messages
790
Reaction score
1
Points
18
Location
UK
First off, thanks for the replies! I'm afraid to say that my experiment is far more basic than that. Literally all I am doing is measuring the lift produced on the wing (indirectly, by measuring the change in mass from a chemical balance - my school's Newton meters aren't sensitive enough) and either the airspeed at the front of the wing, or the angle of attack.

Keith: I was planning on detecting when the wing stalled by looking at a graph of airspeed against angle of attack, and seeing when it the lift generated began to decrease. From various websites and a Java simulator from NASA, this generally seemed to occur at around 10-15 degrees AoA, and so I thought measuring the AoA between -40 and +40 degrees would be more than enough to find the stall angle. As for eliminating the vortex from the fan, I have to say I only found out about that effect earlier today! Something that surprises though is that I still got a correlation coefficient of 0.98, despite the vortex - I would have expected the vortex to be far too turbulent (if that's the right word) to give such a linear relationship.

n72.75: as I mentioned just above, I'm afraid that's way beyond what I was doing in this experiment! :embarrassed:
 
E

ex-orbinaut

Guest
Every different wing section profile has a different relationship between AoA and Cl. And the only way to get it conclusively is by wind tunnel testing. You can go after that simple formula after you solve your present "bugs". Basically, you will be deriving data for your wing, not all in general. That's the first point.

I think (correct me if I am wrong) you are expecting your "lift" values to suddenly disappear at your stall AoA, as in dropping to zero. This is not going to happen. A Robert Ludlum paperback flung through the air will produce aerodynamic forces, but it is not that magical lift. You are looking for the point where the "real" lift falls off from its peak. It also helps to see when the airflow separates from the surface, which should happen at about the same angle. As I said before, tape some bits of string (yarn) to the top surface, about mid chord, and watch for them to suddenly lift up as you increase AoA. This will effectively indicate a "stall" of the airfoil. Let's start with that.

By the looks of it (having not seen your set up), my guess is that you are measuring the total aerodynamic resultant force, which essentially is a vector between the forces of drag and lift.
 

Dambuster

Member
Joined
Sep 13, 2008
Messages
790
Reaction score
1
Points
18
Location
UK
Apologies for not making this clear earlier, but I've actually already finished my experiment, and am now writing the data up. Do you think there's anything I can salvage from this - is the rotating airflow produced by the fan going to invalidate all of my data? Here's a picture of my apparatus (you can just see the chemical balance near the bottom of the image - the wing is indirectly resting on that):

09032010805.jpg
 
E

ex-orbinaut

Guest
Took a moment to absorb your rig. There are the following three points that certainly will affect your data...

1. Congratulations. You invented the proverbial infinite wing! With the airflow only going over a section of it, there is no tip or root to allow some of the effects that feature in Cl calculation. Determining the wing area is impossible.

2. The linear airflow velocity is already variable (that is, decreasing the further away from the fan that it is) long before you put a wing into the flow, which itself functions by (depends on) varying the velocities of a constant airflow at different points along its surface. It is bound to produce garbage data.

3. The velocity of a given cross section of the airflow is not going to be constant from its core to its periphery, which means that as you vary the AoA, you will be producing uneven and inconsistent dynamic pressure, which also upsets the net balance.

Generally, the confusing results derive from the problem of not having a guaranteed, constant airflow.

Anyway, great effort, Dambuster. If you want to play around with the data you did get:

Cl = Lift / (Rho x V^2 x 0.5 x Wing area)

I use imperial figures...

Lift in pounds,
Rho (density in Slugs/Ft^3) England, yes? About 0.00238, Standard ISA.
Velocity in Ft/Sec, squared.
Wing Area in Square Feet.

All the best.:tiphat:
 

Dambuster

Member
Joined
Sep 13, 2008
Messages
790
Reaction score
1
Points
18
Location
UK
Awesome, thank you so much for all the help - I'll do what I can with this data!

:tiphat::cheers:
 

tblaxland

O-F Administrator
Administrator
Addon Developer
Webmaster
Joined
Jan 1, 2008
Messages
7,320
Reaction score
25
Points
113
Location
Sydney, Australia
Generally, the confusing results derive from the problem of not having a guaranteed, constant airflow.
If I read this right, a wind tunnel of some description would improve the result by constraining the air flow? Would something as dodgy as a long cardboard box do the trick? We have boxes at work about 0.25 m x 0.25 m x 1 m long that a fan could be mounted at one end and a wing section somewhere in the middle. Dambuster, perhaps that is something you could add to the discussion section of your report? I always found that it didn't matter how far off your results were from predicted if you could identify possible reasons for why they were off and recommend further experiments that could help reduce the errors.
 

RisingFury

OBSP developer
Addon Developer
Joined
Aug 15, 2008
Messages
6,427
Reaction score
492
Points
173
Location
Among bits and Bytes...
Why did you put the windspeed meteI hope you removed the windspeed meter after you checked the velocity...

What sort of velocity range were you working with? If the velocity range is low enough, of if the you only used a narrow band, then your graph many look linear.


Oh and when presenting data, present it in a way independent of the factors like surface area, air density and coefficient of lift. Those are (hopefully) the same for the duration of the test over various wind speeds. Give lift in relation to wind speed, or better yet, wind speed squared F(v^2). In that case, you should get a linear graph...
 
Last edited:

Arrowstar

Probenaut
Addon Developer
Joined
May 23, 2008
Messages
1,785
Reaction score
0
Points
36
If I read this right, a wind tunnel of some description would improve the result by constraining the air flow? Would something as dodgy as a long cardboard box do the trick? We have boxes at work about 0.25 m x 0.25 m x 1 m long that a fan could be mounted at one end and a wing section somewhere in the middle. Dambuster, perhaps that is something you could add to the discussion section of your report? I always found that it didn't matter how far off your results were from predicted if you could identify possible reasons for why they were off and recommend further experiments that could help reduce the errors.

There was a good discussion on this thread regarding wind tunnel design. Keep in mind that if you do place the airfoil in a wing, you'll need to implement a correction factor when analyzing the data that takes into account the constriction in air flow in the tunnel as angle of attack increases. I believe the raw data will show the lift increasing without bound, but the correction should remove that. You'll need to do some research into how to accomplish this, however, as I don't recall the specifics. It's out there, though.
 
E

ex-orbinaut

Guest
If I read this right, a wind tunnel of some description would improve the result by constraining the air flow? Would something as dodgy as a long cardboard box do the trick? We have boxes at work about 0.25 m x 0.25 m x 1 m long that a fan could be mounted at one end and a wing section somewhere in the middle.

It would improve the results, little doubt. And something like those cardboard divisions they use to separate bottles in boxes, placed in the "tunnel", downstream of the fan and upstream of the wing would help eliminate the swirl. The only snag would be that, in such a constrained space, as the AoA was increased, you would also be measuring ground effect, off the bottom of the box, as the distribution of the lift shifted toward downwash generated lift. However, this is not a bad thing, is valid data in a sense, and could be considered an integral part of the experiment. :)

Edit:

Talking of ground effect, this was one of its more innovative applications, almost straight out of Thunderbirds...

http://www.livephysics.com/gallery/v/aviation/experimental/ekranoplan.jpg.html

Still not sure if it was considered a naval vessel or an aircraft by the Soviet armed forces.
 
Last edited by a moderator:
Top